About the author call_made
Felix Braberg
Mobile Ad Revenue expert, podcaster, and passionate about all things mobile.

AnalysisJournal 135 Felix Braberg November 8
For the fourth installment of Getting Started with Mobile Ad Revenue, we’ll dive deep into Applovin MAX and its features. Here’s what we’ll cover:
As with our previous blog posts on Admob and LevelPlay:
We’ll kick off with the pros and cons of using MAX mediation.
Pros:
Cons:
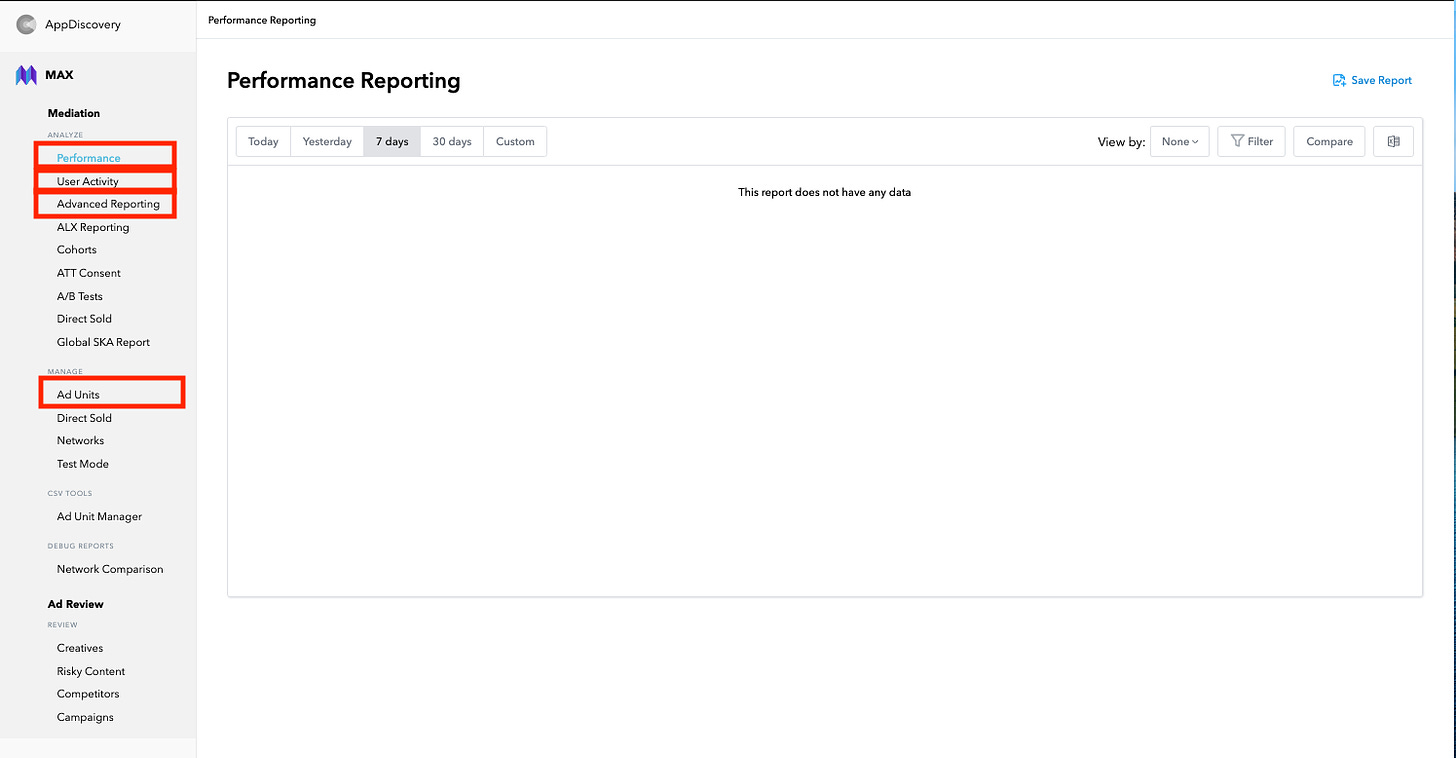
First, apply for MAX access via the Applovin website. Once approved, you’ll receive a confirmation email, and you can log in to your MAX account. Upon your first login, you’ll see your MAX dashboard located under “AppDiscovery.” Most of your work will take place in Performance, User Activity, and Ad Units. We’ll walk you through each of these sections to help you maximize your ad revenue.
Getting Started
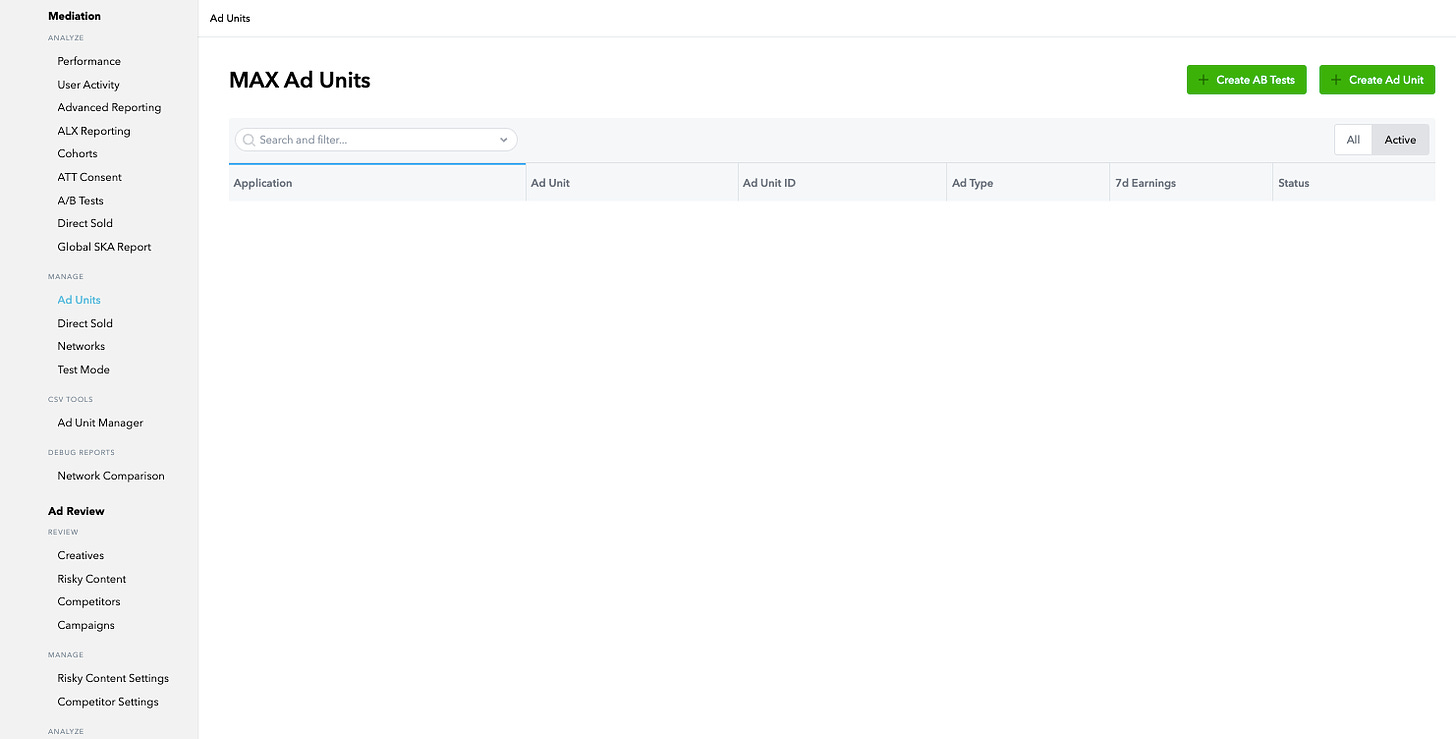
First things first, to start serving ads in your app, you need to set up an Ad Unit. Go to “Manage → Ad Units → Create Ad Unit.”
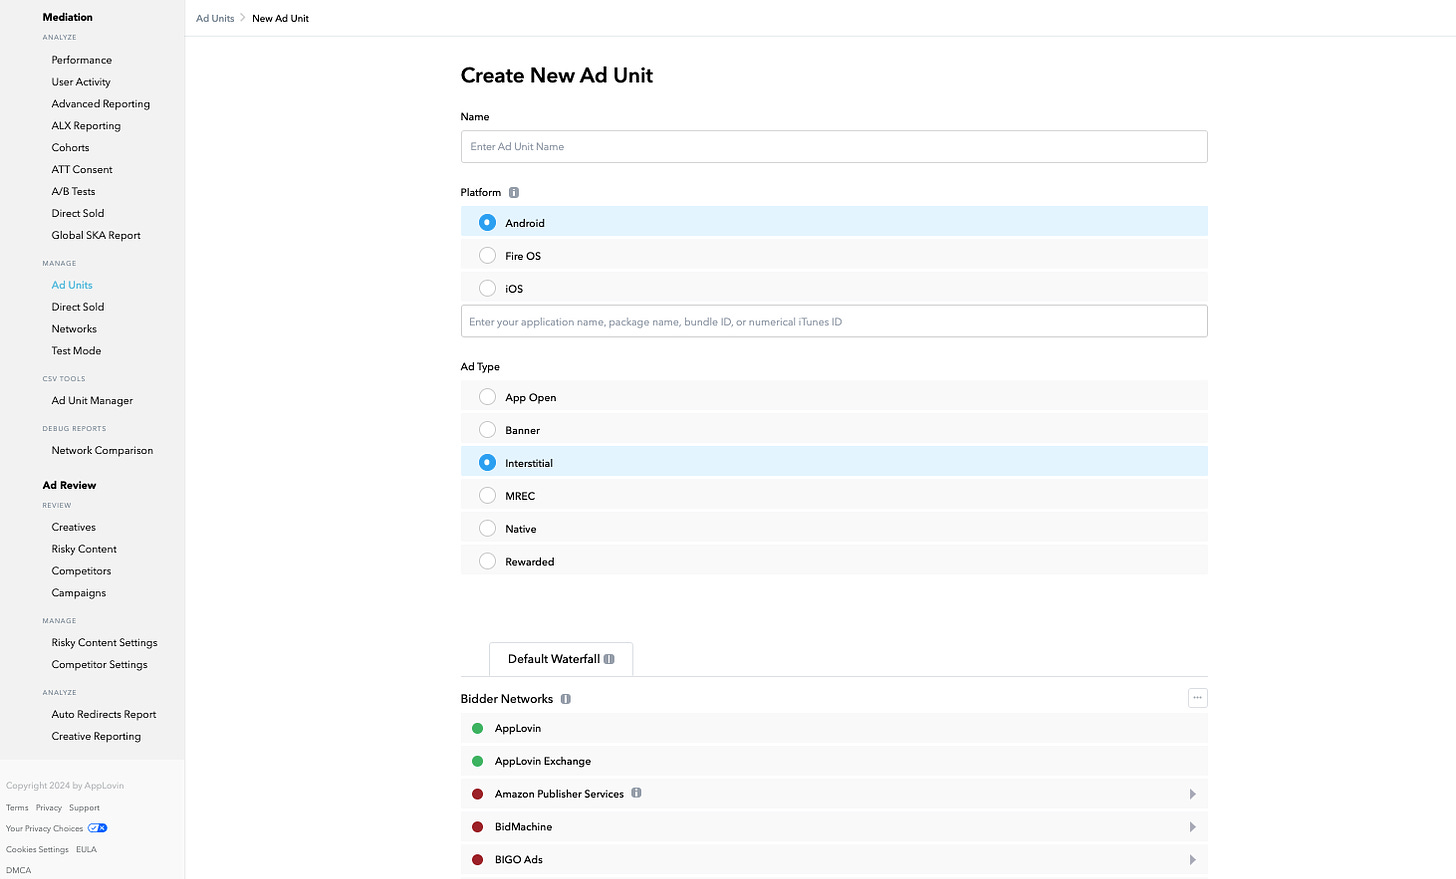
On the Ad Unit setup page, start by selecting the OS and ad type, then locate your app by entering the package name or bundle ID. If your app isn’t live yet, you can still create your ad unit. Once you’ve found your app, scroll down and click “Save.” Your newly created App will now appear under “Ad Units,” where you’ll also find the unit ID code needed for developer integration.
One common mistake to avoid here is creating too many ad units. Even if you have multiple ad placements in a game or app, it’s best to create only one ad unit per ad format. For example, if your game has five Rewarded Ad Placements, they should all be set up under the same ad unit ID. This approach centralizes all impressions to a single waterfall, maximizing revenue and saving you significant time.
After setting up your ad units, the next step is integrating a few networks to keep your ad stack competitive. Below are the recommended networks for starting on MAX, which should be sufficient until your ad revenue scales to about $600-$1K/day:
Rewarded Video & Interstitials:
Banners:
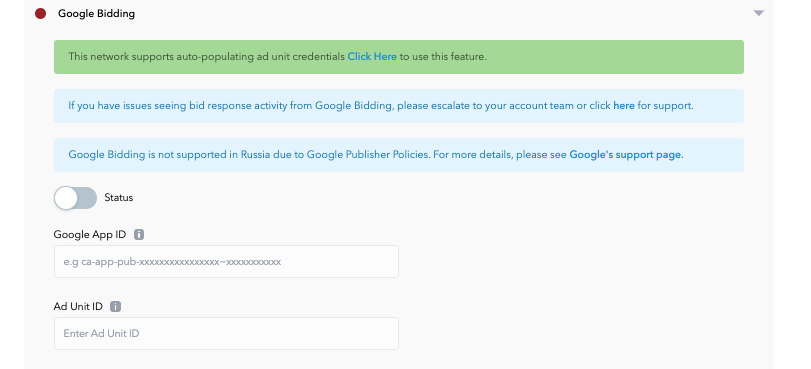
To set up these networks, create an account with each one and configure the ad units on their platform. Once completed, return to your Ad Unit in MAX to enter the necessary details for both bidding and non-bidding networks. Remember to press “Save” at the bottom of the page; otherwise, you’ll lose any data entered if you navigate away. This setup assumes your developers have already integrated the SDK adapters for each network.
This next step is crucial, so don’t skip it! You’ll need to set up Network Reporting for all your networks. This setup allows you to run debug reports if revenue discrepancies arise (and trust me, they will at some point). Remember, MAX is a mediation tool that consolidates revenue from different networks, but each network handles its own payments. If there’s an error, this tool helps pinpoint what’s going wrong and where. Revenue data discrepancies happen more often than you might think, and connecting networks for reporting will help you spot issues much faster.
 Mobile Ad Revenue
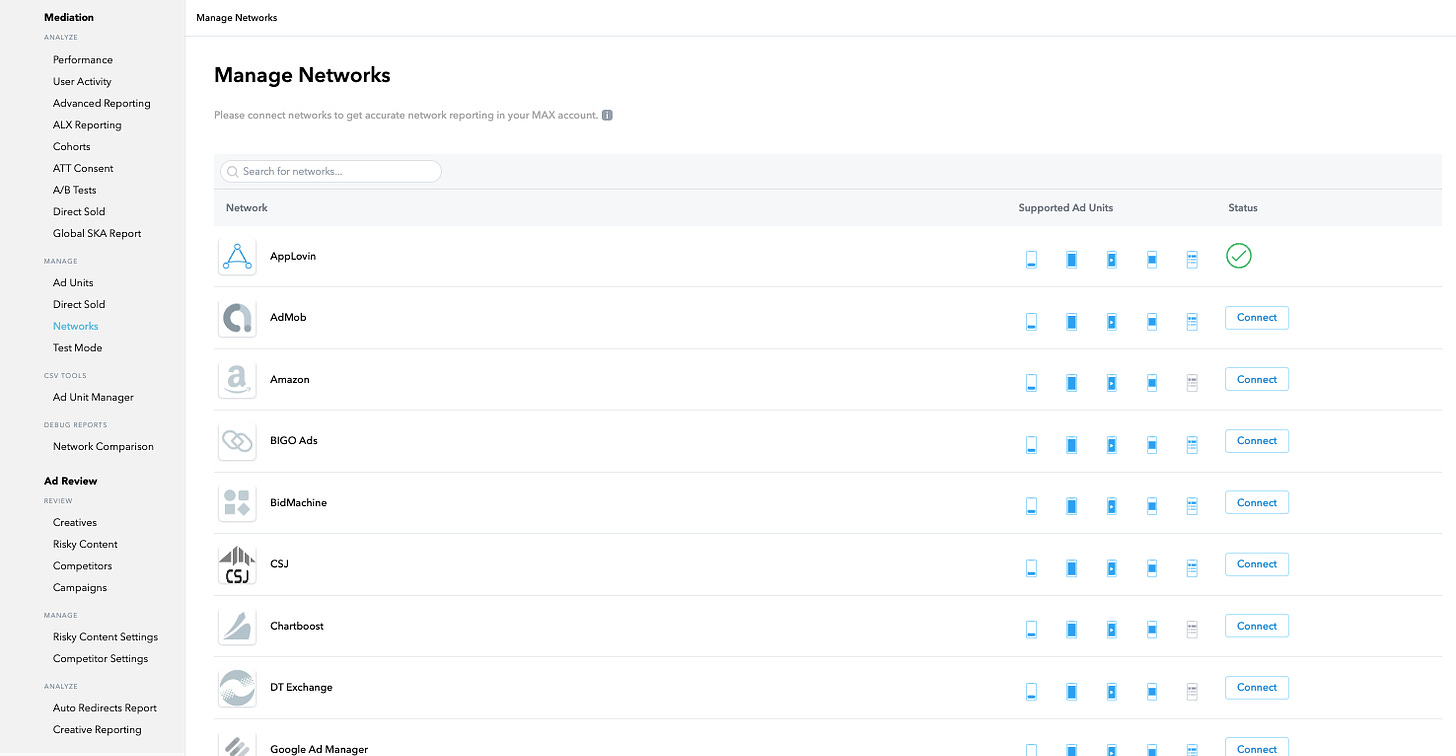
To add networks, go to “MAX → Manage → Networks → Connect.” Make sure to connect all networks integrated into your ad stack. This simple step can save you from a lot of hassle and potential revenue loss. You can check for discrepancies by running debug reports under “MAX → Debug Reports.”
Once you’ve setup all your bidder networks and non-bidding networks you will need to update your app-ads.txt file accordingly. You can find your Applovin entries under “MAX→Account→App-ads.txt info”. After this you’re all set and ready to go!
Under Performance, you’ll find all your revenue metrics. One common heart-stopping moment for newbies on the platform is seeing how MAX reports on today’s revenue, which can make all the graphs appear to slope downward, giving the impression that revenue is decreasing. Stay calm—this is normal, as revenue naturally appears lower before the day is completed.
Under “View by,” you can filter by Application, Network, and Ad Type. You can combine this with the Filter option, allowing you to break down metrics by app, country, and ad type for more detailed insights.
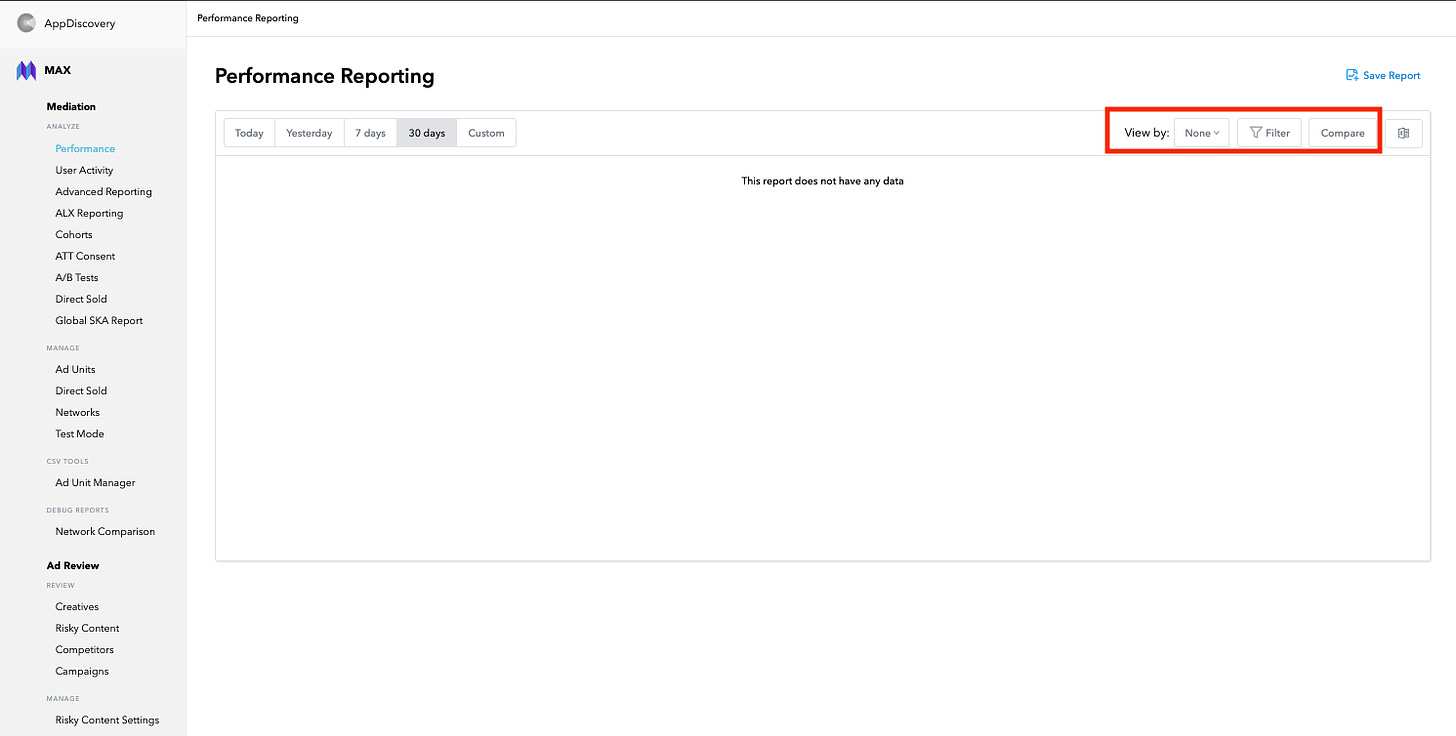
To effectively monitor your performance, I strongly recommend regularly checking the following breakdowns: View by “App” and “Network,” and select the specific apps you’re monetizing under Filter. Look for any increases, decreases, or deviations from the usual revenue patterns. If a network’s revenue suddenly drops or spikes, it’s essential to investigate and understand the cause. Focusing only on topline revenue can lead to missed details that may end up costing you significant ad revenue.

The Performance tab is excellent for viewing revenue metrics, but it’s also important to combine it with user activity insights. Navigate to MAX → User Activity to access all data related to what users are actually doing in your game.
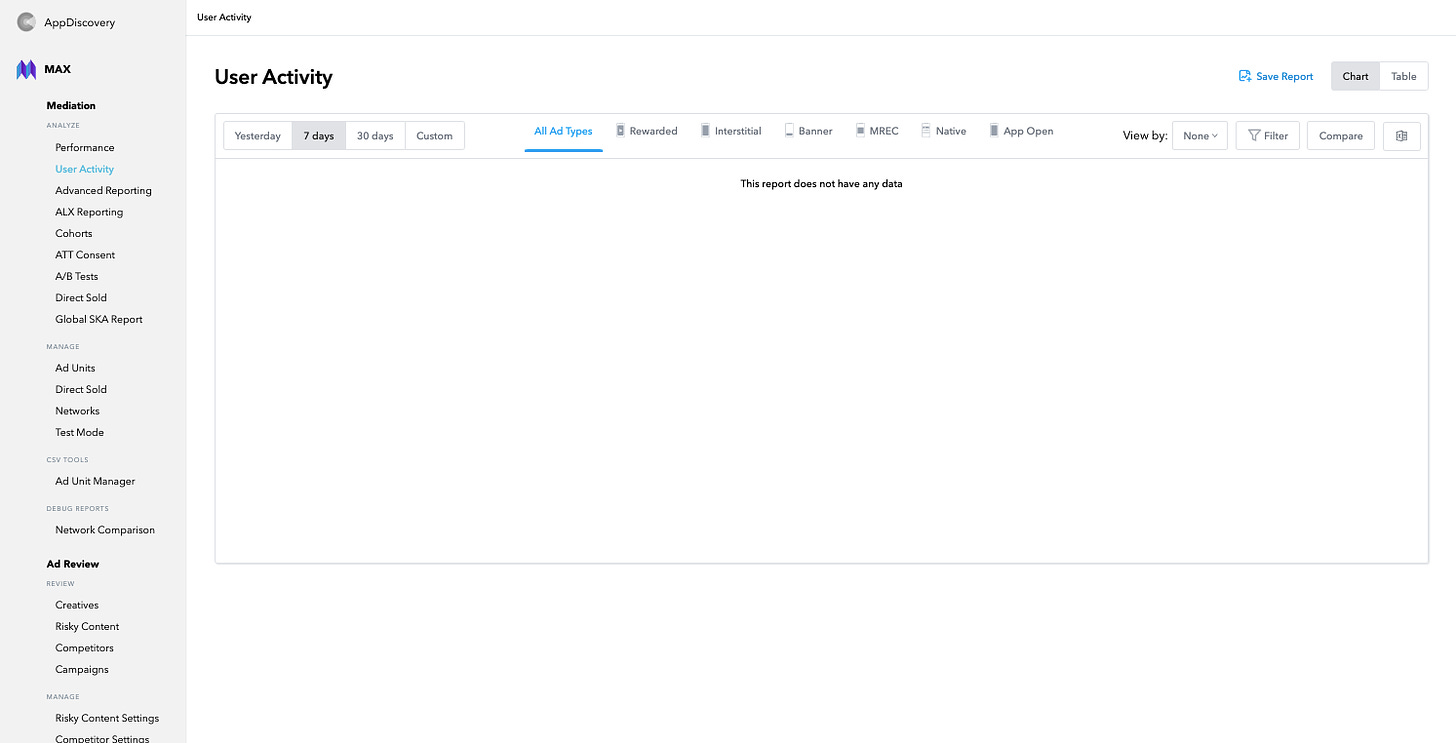
The key metrics to monitor here are ARPDAU, particularly AdARPDAU, which we’ve covered extensively in this series. Additionally, keep an eye on Ad Viewer Rate and IMP/DAU. I recommend reviewing User Activity data alongside Performance data. If you notice any deviations from your usual revenue patterns, it’s worth checking if they correlate with game metrics like a drop in IMP/DAU or Ad Viewer Rate. For instance, if you see a decrease in revenue along with a decline in Ad Viewer Rate, the issue is likely within your app or game rather than network-related.
While the Performance and User Activity tabs are helpful for top-line and usage metrics, actionable data for A/B testing requires the Advanced Reporting tool. To launch an A/B test, gather a few days of revenue data, then go to your Ad Unit and select Create A/B Test in the top right corner next to bidder networks.
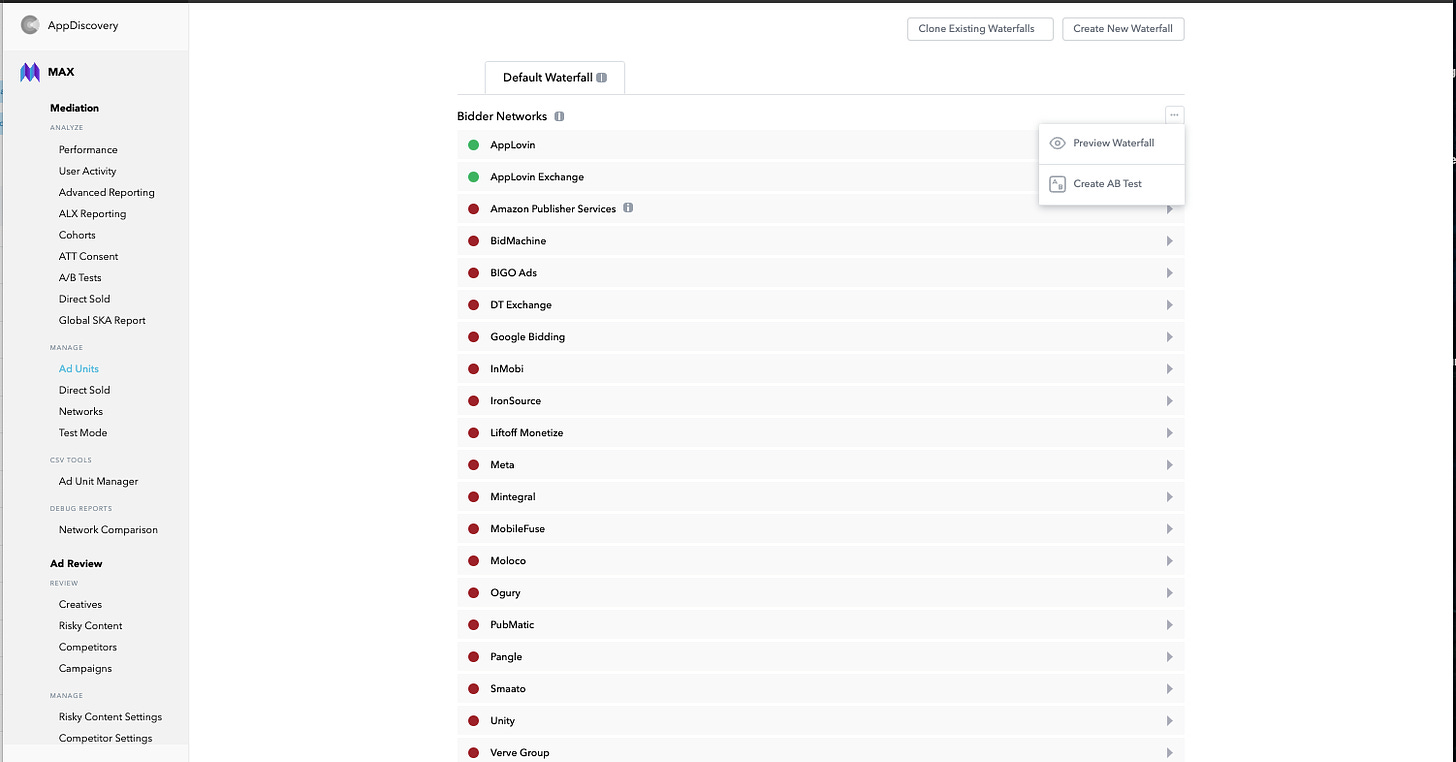
Select a 50/50 split to clone your waterfall into two groups: a control group and a test group. You can toggle between the Control and Test views. All adjustments for your A/B test should be made in the Test waterfall.

Now, let’s determine what changes we need to make in our A/B test. Head to MAX → Advanced Reporting; mastering this tool is essential for running your first A/B tests in MAX.
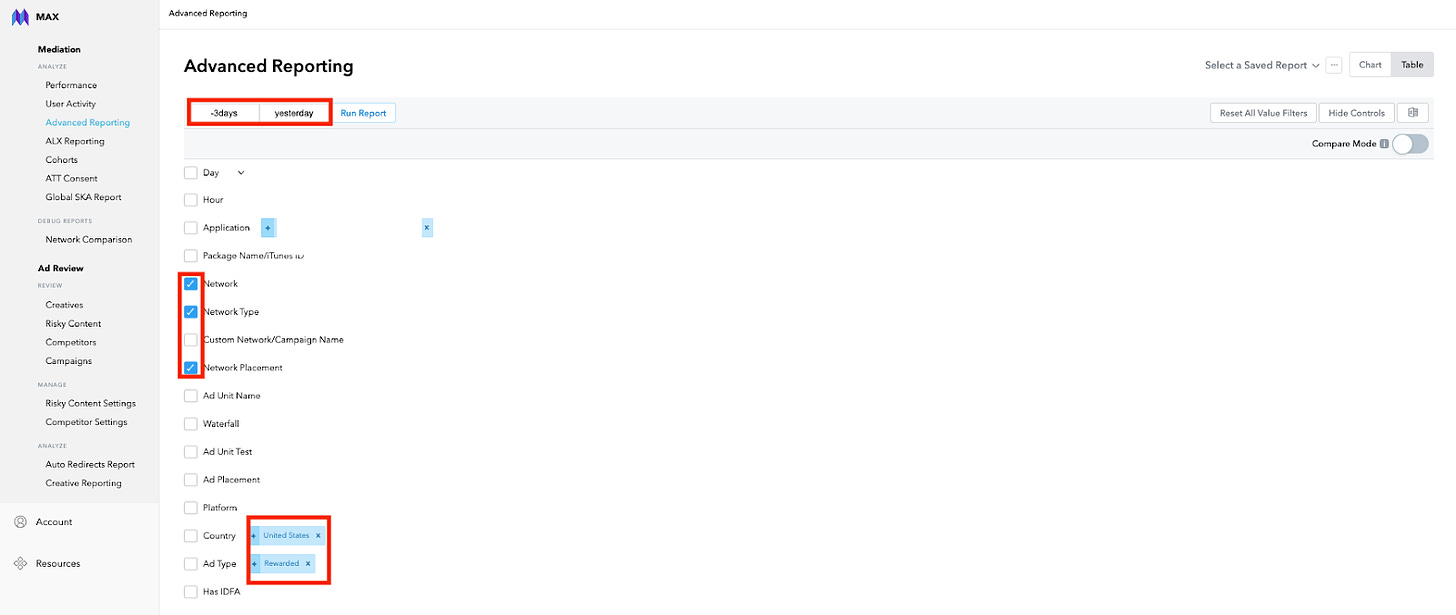
In the timeline, enter “-3days” and “Yesterday” to automatically select the past three days compared to yesterday for your report. Select one application, and tick the boxes for “Network,” “Network Placement,” and “Ad Type.” Under Ad Type, choose Banner, Interstitial, or Rewarded, depending on which ad unit you’re analyzing. Click “Run Report” next to the date range, then scroll down to view your waterfall. Filtering by “eCPM” will give you a clear view of your waterfall setup.
Pro tip: Click the “…” button at the top right to save this report. Create separate reports for each OS and ad type you’re running, allowing you to pull the same report with updated data in just a few clicks next time.
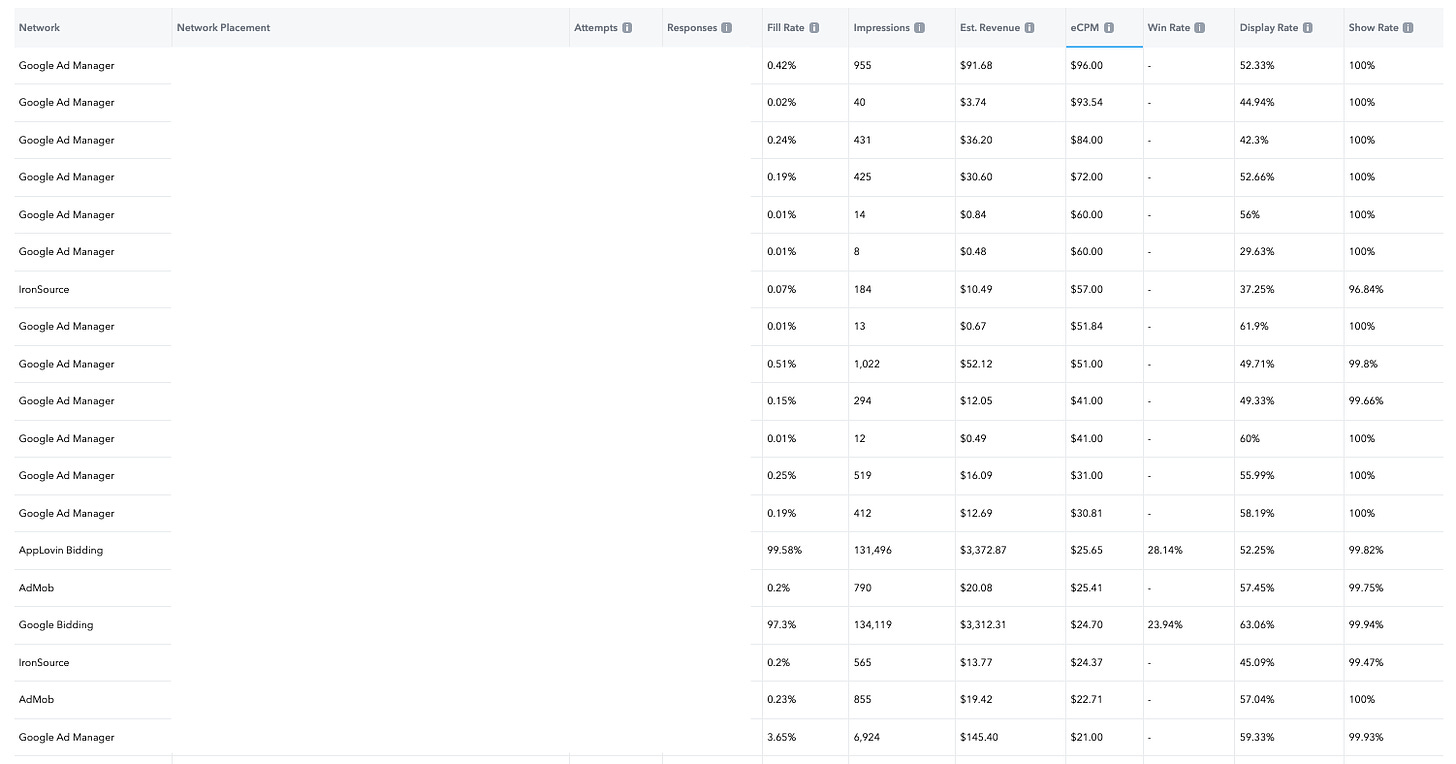
If you’ve filtered the data correctly, your report should look similar to the example above. When reviewing this data, aim for each placement in your waterfall to fill above 1% or generate at least 1% of total waterfall revenue. For instance, if your waterfall generated $10,000 in revenue, each placement should ideally contribute around $100.
Thanks for reading Brutally Honest by Matej Lancaric! This post is public so feel free to share it.
In the example, placements highlighted in red should be removed, while those in green should be retained. Notably, the Google Ad Manager placement fills well above the $100 benchmark at over 3.65%. This indicates that the network can handle a higher price, so consider creating a new placement for that network at a higher rate, such as $27 or $30.

Generally, you’ll be running three main types of A/B tests: Latency Removal, Building High-Performing Placements, and Launching New Networks.
 Mobile Ad Revenue
All launched A/B tests can be monitored under “MAX → A/B Tests.”

As more networks move to header bidding, the need for A/B tests decreases. However, if you’re still running even one network on placements, these tests remain essential for optimizing revenue. Here are a few pointers to help determine if a bidder network is worth keeping in your ad stack.
When setting up banners in MAX, the default refresh setting is “Optimized by MAX,” which typically means a refresh rate of around 10 seconds. Testing different refresh rates is recommended, as a slower refresh rate may reduce eCPM but increase impressions. To find the ideal balance for revenue, experiment with different rates.
Each ad unit has an option for setting bid floors, which establishes a minimum price for showing an ad. Adjusting these floors can be high-risk, as it might decrease overall revenue, but it can be especially useful for interstitial ads, which impact retention most. Start with low floors and monitor the effect on revenue—earning more by showing fewer interstitials is beneficial. Be aware that average eCPMs vary throughout the year, so retesting bid floors as eCPMs change is a smart move.
If you implement the Ad Review SDK, you can monitor all creatives currently shown in your app under “MAX → Ad Review.” It’s a good practice to check this regularly to ensure the ads in your app align with your brand guidelines.
That sums up this introduction to MAX mediation. For more advanced Mobile ad monetization tips, please consider subscribing to my substack. Or, if you’re looking for more general UA, Game Design, and Ad Monetization tips, you should subscribe to the 2.5 Gamers podcast.
Felix Braberg
 Mobile Ad Revenue
About the author call_made
Mobile Ad Revenue expert, podcaster, and passionate about all things mobile.
Please login or subscribe to continue.
No account? Register | Lost password
✖✖
Are you sure you want to cancel your subscription? You will lose your Premium access and stored playlists.
✖