Background
  • arrow_back Home
  • keyboard_arrow_rightAuthor archive 2025

Sven Jürgens

trending_flat

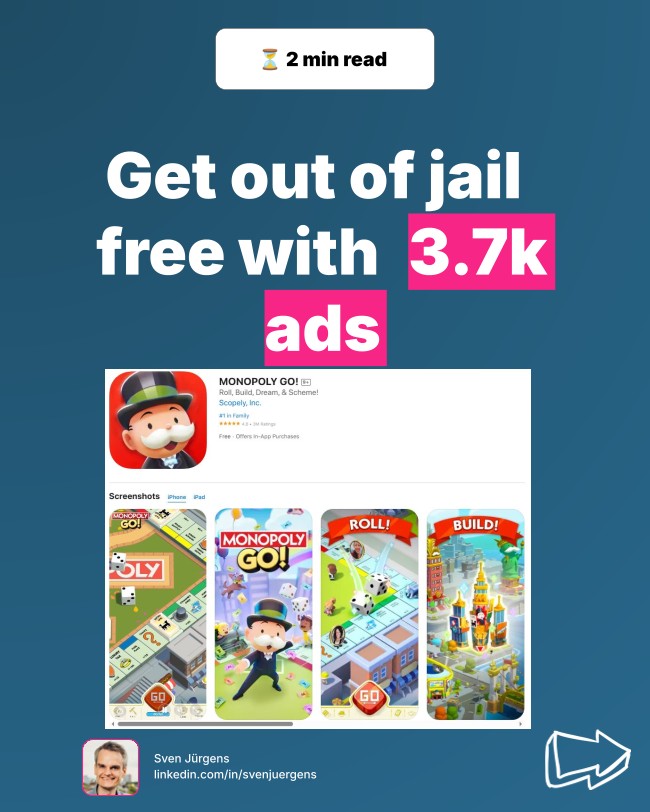
Monopoly GO makes $104M per month. Their 3.7K Ads Strategy?

🎲♟️ Monopoly Go is making $104M per month. Here’s what I saw in their 3.7k ads strategy 👇 🎯 Winning Ads Run for 30+ DaysMost of their Meta ads stay live for over a month, which means (for me) they’re betting more on branding than rapid iteration.👵📊 Older Players == More Spending PowerUnlike many mobile games, 40+ users make up a bigger share of their audience. And older players tend to spend more.🥐 France #1France gets the most ad impressions in Europe, which matches its high download ranking.📱 Google Play Gets More TrafficThey drive 64.5% of their traffic to Google Play vs. 35% to Apple. I am not sure why that is, honestly.🎥 Simple Ads Work (again)Their best-performing ad? No voiceover, just in-game animations and a catchy hook:✅ “Simple Tips to Get Rich!” (will also work in 100 years, I […]

trending_flat

Calculate LTV Without Going Crazy?

📊 How to Calculate Lifetime Value (LTV) Without Going Crazy? Ever been asked about your app’s Lifetime Value (LTV) and drawn a blank?You’re not alone.🤔 What is Lifetime Value (LTV)?Simple definition: The total money a customer will bring to your business over their entire relationship with your app.Think of it like this:💰 Revenue = Price × Number of Purchases🏷️ Price = What they buy🔄 Quantity = How often they buy⚠️ Why LTV Prediction is TrickyLet’s be real—it’s complicated.Economists have spent years trying to crack this.The hard truth? It’s always a prediction, never 100% accurate.The goal is to be "usefully wrong."🧮 Quick LTV Calculation MethodI've created a simple spreadsheet to help you out:✅ Enter your key metrics✅ Get a basic LTV prediction✅ No complex math required📎 Here you go.

trending_flat

Revenue Drop? Here’s Your Detective Kit

🕵️‍♂️💸 Revenue Dropped? Here's Your Detective Kit! Tired of staring at analytics with no clue what's going on? I built a simple spreadsheet that cuts through the noise.🔎 What This IsA no-BS template to track why your app’s revenue is up or down. It helps you quickly figure out if:✅ Fewer people are buying✅ Prices changed✅ Ad impressions dropped✅ Refunds went crazy⚙️ How It Works1️⃣ Grab the template 👇2️⃣ Input your numbers from two time periods3️⃣ See exactly what moved the needle🚀 Why This MattersWhen someone asks, “What happened to our revenue?”, you’ll have a clear answer—instead of mumbling something about "changing market conditions..."Worked great when I was managing thousands of campaigns at AppLike. Saves hours of digging through data.Kudos to the BI team who came up with this (original article)My Excel Template💡 Bonus: For teams wanting to level up, […]

Login to enjoy full advantages

Please login or subscribe to continue.

Go Premium!

Enjoy the full advantage of the premium access.

Stop following

Unfollow Cancel

Cancel subscription

Are you sure you want to cancel your subscription? You will lose your Premium access and stored playlists.

Go back Confirm cancellation