Revenue Drop? Here’s Your Detective Kit
Journal 8 Sven Jürgens April 1

🕵️♂️💸 Revenue Dropped? Here’s Your Detective Kit!
Tired of staring at analytics with no clue what’s going on?
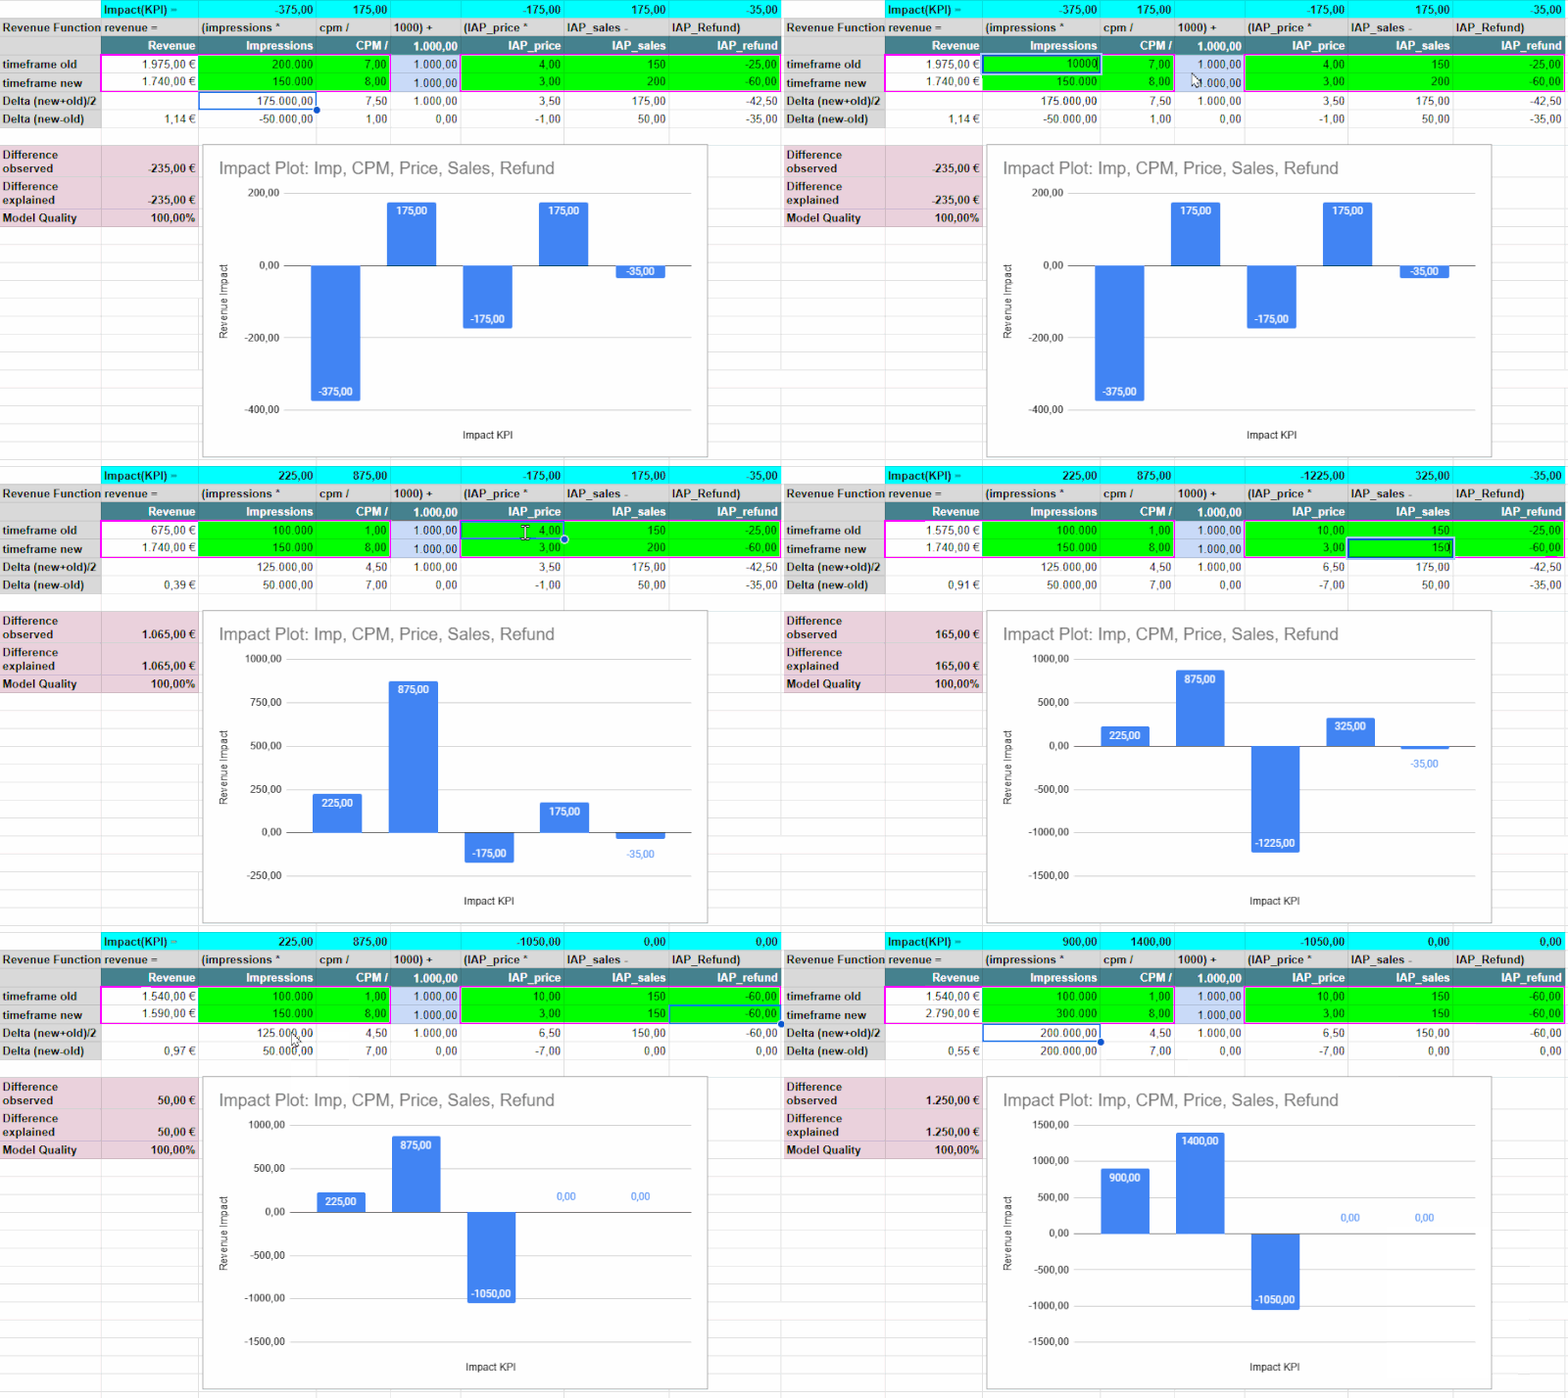
I built a simple spreadsheet that cuts through the noise.
🔎 What This Is
A no-BS template to track why your app’s revenue is up or down. It helps you quickly figure out if:
✅ Fewer people are buying
✅ Prices changed
✅ Ad impressions dropped
✅ Refunds went crazy
⚙️ How It Works
1️⃣ Grab the template 👇
2️⃣ Input your numbers from two time periods
3️⃣ See exactly what moved the needle
🚀 Why This Matters
When someone asks, “What happened to our revenue?”, you’ll have a clear answer—instead of mumbling something about “changing market conditions…”
Worked great when I was managing thousands of campaigns at AppLike.
Saves hours of digging through data.
Kudos to the BI team who came up with this (original article)
My Excel Template
💡 Bonus: For teams wanting to level up, this can be automated with the right scripts.


